
Consumer Preference for Collision Protection Technologies Paves the Way for Autonomous Driving
Apple CarPlay vs. Google Android Auto? It Depends on Your Phone
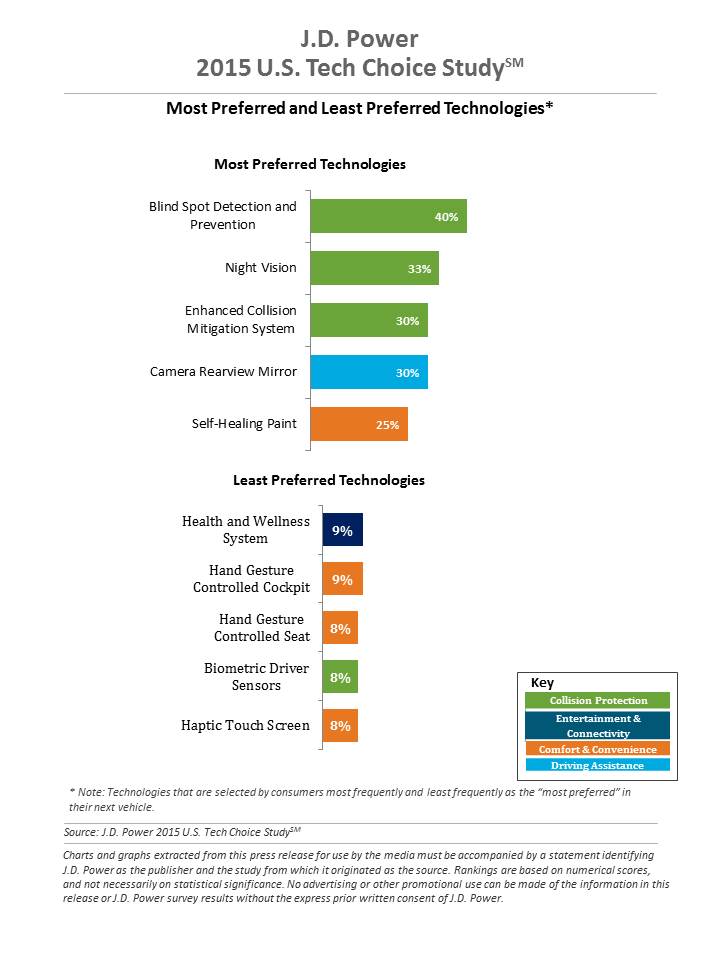
WESTLAKE VILLAGE, Calif.: 22 April 2015 — Three of the top five technologies consumers most prefer in their next vehicle are related to collision protection, according to the J.D. Power 2015 U.S. Tech Choice StudySM released today.
Technologies that reduce the overall burden of driving and enhance the safety of the vehicle and its occupants receive the most consumer attention. Among the technologies consumers express most interest in having in their next vehicle are blind spot detection and prevention systems, night vision, and enhanced collision mitigation systems. These findings demonstrate growing customer acceptance towards the concept of the vehicle taking over critical functions such as braking and steering, which are the foundational building blocks leading to the possibility of fully-autonomous driving.
The only non-collision protection technologies to crack the top five are camera rearview mirror, which falls into the driving assistance category, and self-healing paint, a comfort and convenience category.
The inaugural study uses advanced statistical methodologies to measure preference for and perceived value of future and emerging technologies. A total of 59 advanced vehicle features are examined across six major categories: entertainment and connectivity; comfort and convenience; collision protection; driving assistance; navigation; and energy efficiency.
“There is a tremendous interest in collision protection technologies across all generations, which creates opportunities across the market,” said Kristin Kolodge, executive director of driver interaction & HMI research at J.D. Power. “In contrast, there is very little interest in energy efficiency technologies such as active shutter grille vents and solar glass roofs. Owners aren’t as enthusiastic about having these technologies in their next vehicle because of other efforts automakers are taking to improve fuel economy, as well as relatively low fuel prices at the present time.”
Apple CarPlay vs. Google Android Auto
Smartphones play an increasingly vital role in everyday life, and vehicle technology is beginning to mirror what is offered on those devices, yet Apple CarPlay and Google Android Auto technologies consistently have among the lowest preference scores across all generations.
Consumer preferences for Apple CarPlay and Android Auto are uniquely dependent on which smartphone they own. Those who currently own a smartphone that is compatible with one of these technologies would choose the technology compatible with their phone at only a moderate rate, while those with the opposite brand of smartphone will rarely, if ever, choose that technology. For example, Android owners indicate that Apple CarPlay is “unacceptable” nearly twice as often as they indicate that solar glass roof is unacceptable. Similarly, Apple phone owners indicate that Android Auto is “unacceptable” nearly twice as often as solar glass roof.
Kolodge noted that “lukewarm interest in these technologies that connect your phone to your vehicle coupled with consumer loyalty to their phone poses a unique challenge for automakers, which could be remedied by knowing their customers’ phone preferences.”
“Owners of luxury vehicles tend to own iOS devices,[1] so for many luxury brands, offering Apple CarPlay may be the best option, realizing they may be leaving out a portion of the market,” said Kolodge. “For non-luxury vehicle brands, the ownership of Apple and Android devices is much closer to an equal split. The solution for those brands may be to offer both operating systems and allow customers to select the option best suited for them.”
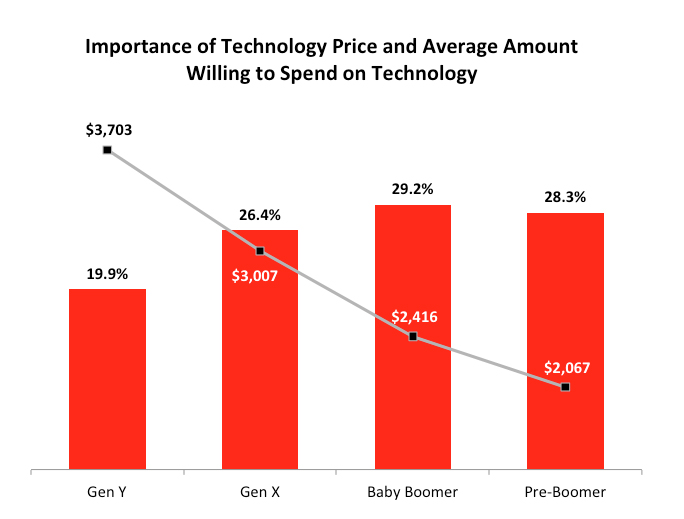
Gen Y Willing to Spend Most for Technology
Across all generations[2], price is the most important consideration for technology, accounting for 25.2 percent of importance. Gen Y is the least sensitive to technology price and shows a greater willingness to spend on new technologies than the other generations. Gen Y consumers, who have accounted for 27.7 percent of new-vehicle sales thus far in 2015[3]—second only to Boomers at 37.1 percent—are willing to spend an average of $3,703 on technology for their next vehicle. Gen X is willing to spend $3,007, while Boomers, who show the greatest price sensitivity, and Pre-Boomers are willing to spend only $2,416 and $2,067, respectively.
Importance of Technology
A certainty in the automotive domain is the impact the consumer electronics world has had upon it. From shifting consumer expectations of user interaction, to the rapid pace of technology introduction and importance of keeping software up to date, to the miniaturization and creation of cost-effective solutions for sensors and cameras, “the auto industry is standing on its head to keep technology up to consumers’ new standards,” said Kolodge. “Those who haven’t done so have seen negative feedback from consumers.”
KEY FINDINGS
- Full self-driving automation technology, part of the collision protection category, is designed to perform all safety-critical driving functions and monitor roadway conditions. The younger generations (Gen Y and Gen X) have substantially higher preference for the technology than the older generations (Boomer and Pre-Boomer). The Pre-Boomer generation, in contrast, has a greater preference for lower levels of automation, such as traffic jam assist.
- ŸBlind spot detection and prevention has high preference across the range of vehicle price segments. In contrast, reverse auto braking systems have low preference across the vehicle price segments and preference wanes as vehicle prices increase.
- ŸAdvanced sensor technologies, such as hand gesture controlled seats, biometric driver sensors or haptic touch screens have low preference.
- ŸTechnologies in the navigation category have low preference across all vehicle price segments.
The 2015 U.S. Tech Choice Study was fielded in January through March 2015 and is based on an online survey of more than 5,300 consumers who purchased/leased a new vehicle in the past five years.
[1] J.D. Power 2014 U.S. Initial Quality StudySM
[2] J.D. Power defines generational groups as Pre-Boomers (born before 1946); Boomers (1946-1964); Gen X (1965-1976); and Gen Y (1977-1994).
[3] Power Information Network® (PIN) from J.D. Power